Playalytics
Exploring Gaming From Score to Sales
by Wenge Wang

Overview
Have you ever wondered what's hot in the current gaming world and which genres are making waves?
As a video game enthusiast, I wanted to explore the popularity and I'm wondering whether
professional critics' ratings correlate with sales.
With open data from Kaggle, I conducted a comprehensive analysis of each publisher's
performance across various classic gaming categories, examining metrics including critic scores,
sales figures, and the number of games published.
Date
Mar, 2023
Mar, 2024 (Update)
Tools
Python, Plotly.js, D3.js
Steam Store 2024 Hot Picks
Hover to explore what's trending ⤵

Ori and the Will of the Wisps
Genre: Platform
Reviews: Overwhelmingly Positive

God of War
Genre: Action-adventure
Reviews: Overwhelmingly Positive

LEGO® Star Wars™ - The Complete Saga
Genre: Action-adventure
Reviews: Overwhelmingly Positive

STAR WARS™ Empire at War - Gold Pack
Genre: Strategy
Reviews: Overwhelmingly Positive
Through Latent Dirichlet Allocation (LDA) analysis of the descriptions of top games with
overwhelmingly positive user reviews in 2024, two
distinct groups emerged.
One group revolves around themes of war, survival, and
fight, appealing to players seeking intense action and strategic challenges. The other
group is characterized by adventure, fantasy, and action, for gamers interested
in storytelling and exploration.
Source from: Kaggle
Keyword Co-occurrence Network
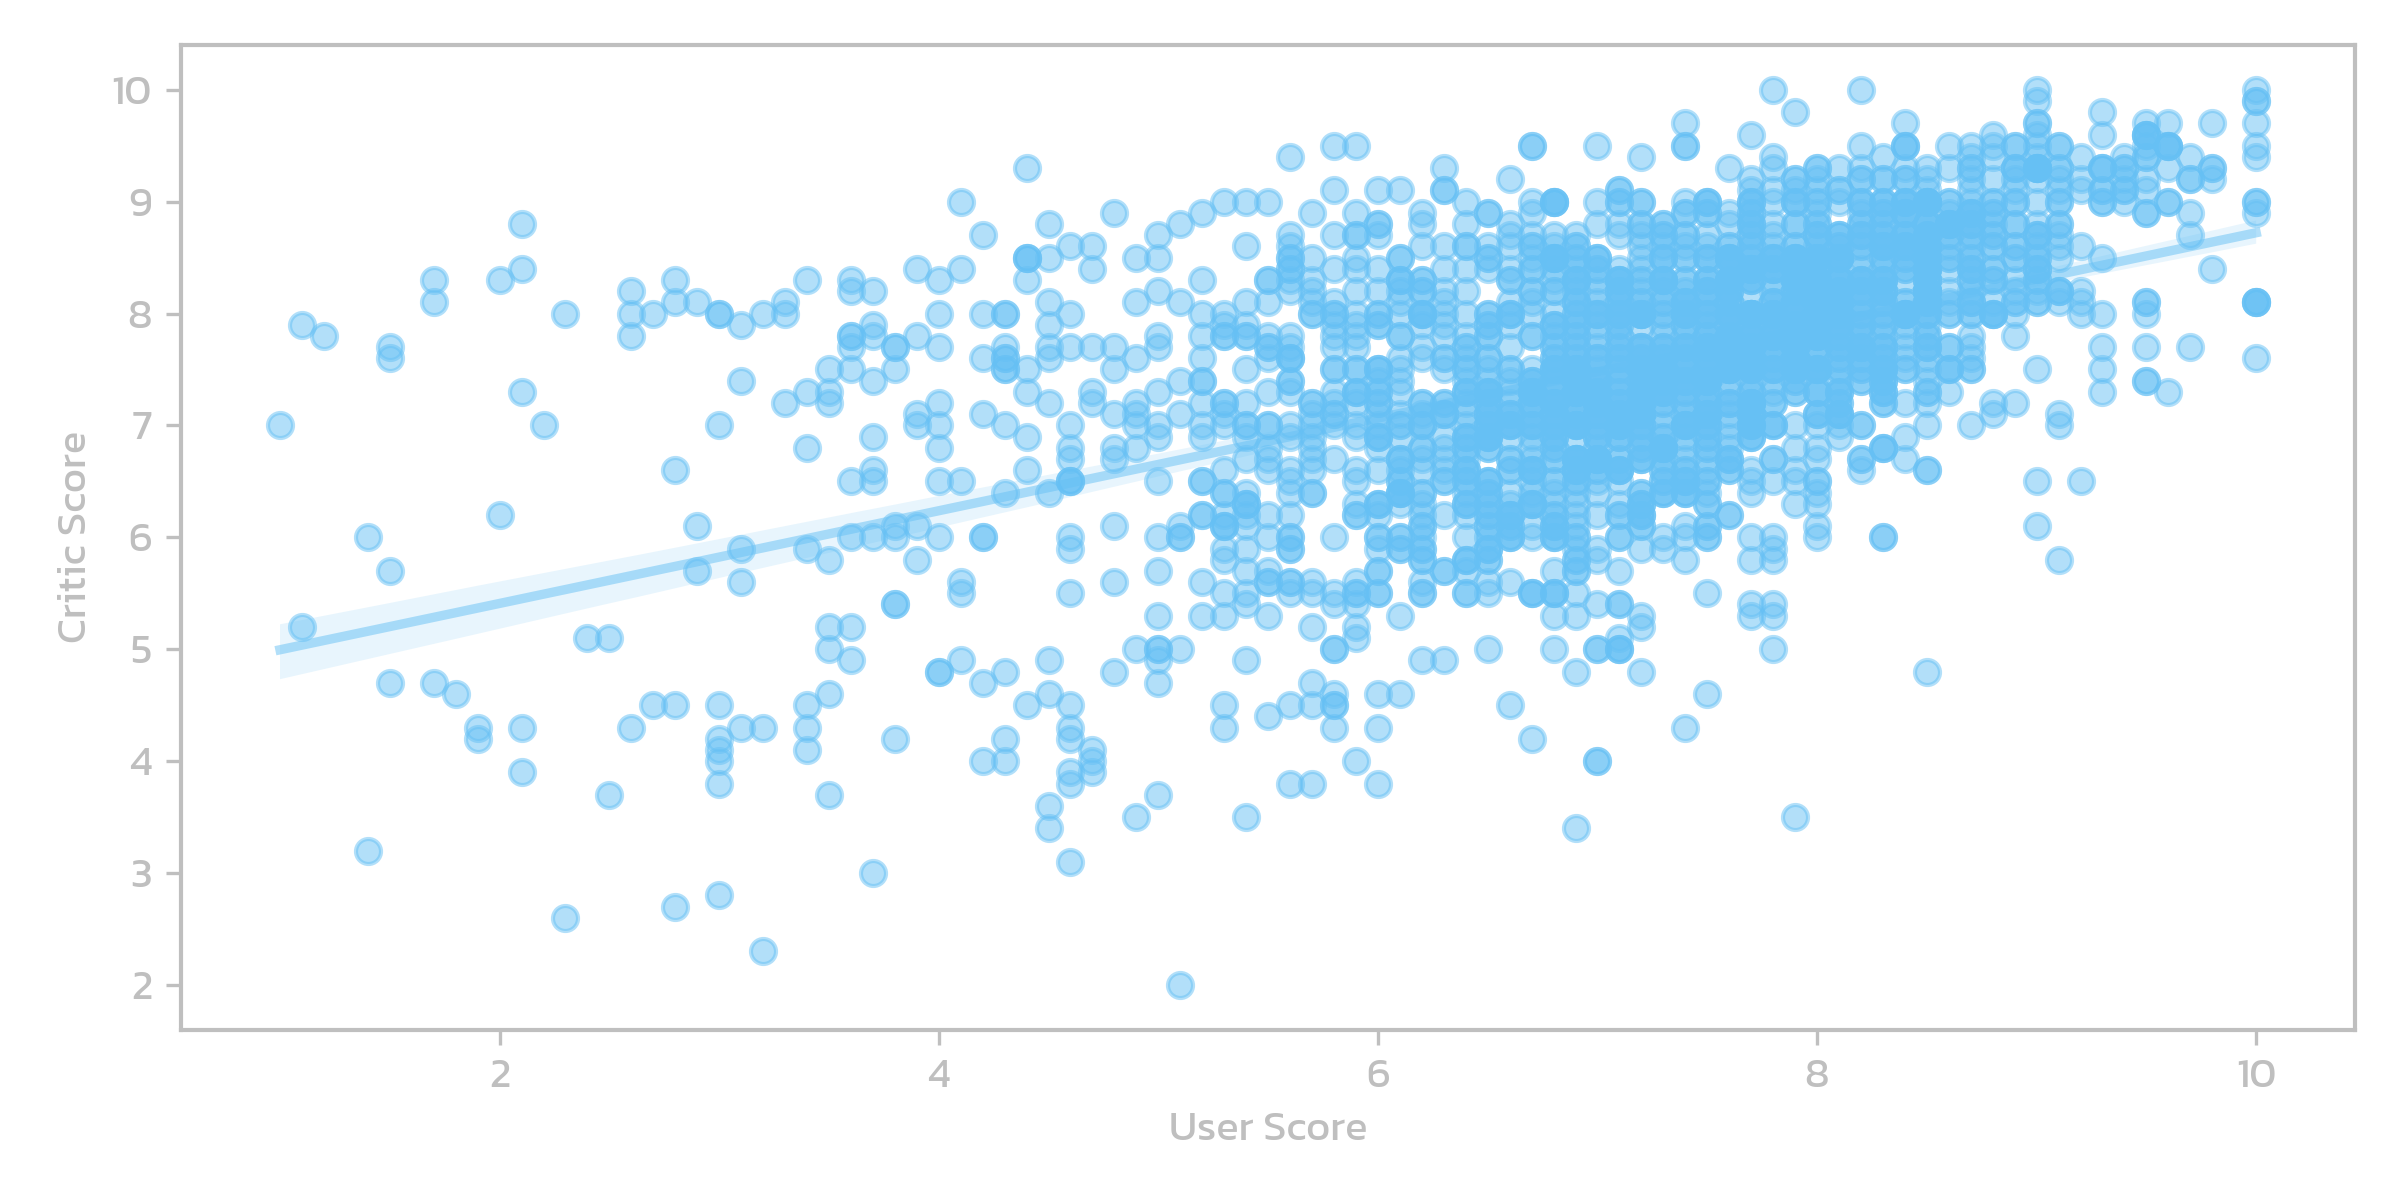
User Score vs. Criitic Score
Despite a low R-squared value (less than 0.3), the scatter plot of user score versus critic score reveals intriguing trends. Notably, games with higher user scores, particularly those exceeding 0.5, exhibit a clear positive linear relationship with critic scores. However, for games with lower user ratings, the correlation appears more scattered, indicating a looser association. This suggests that while highly-rated games by users tend to receive favorable critic scores, the relationship is less consistent for games with lower user ratings.
Source from: Kaggle
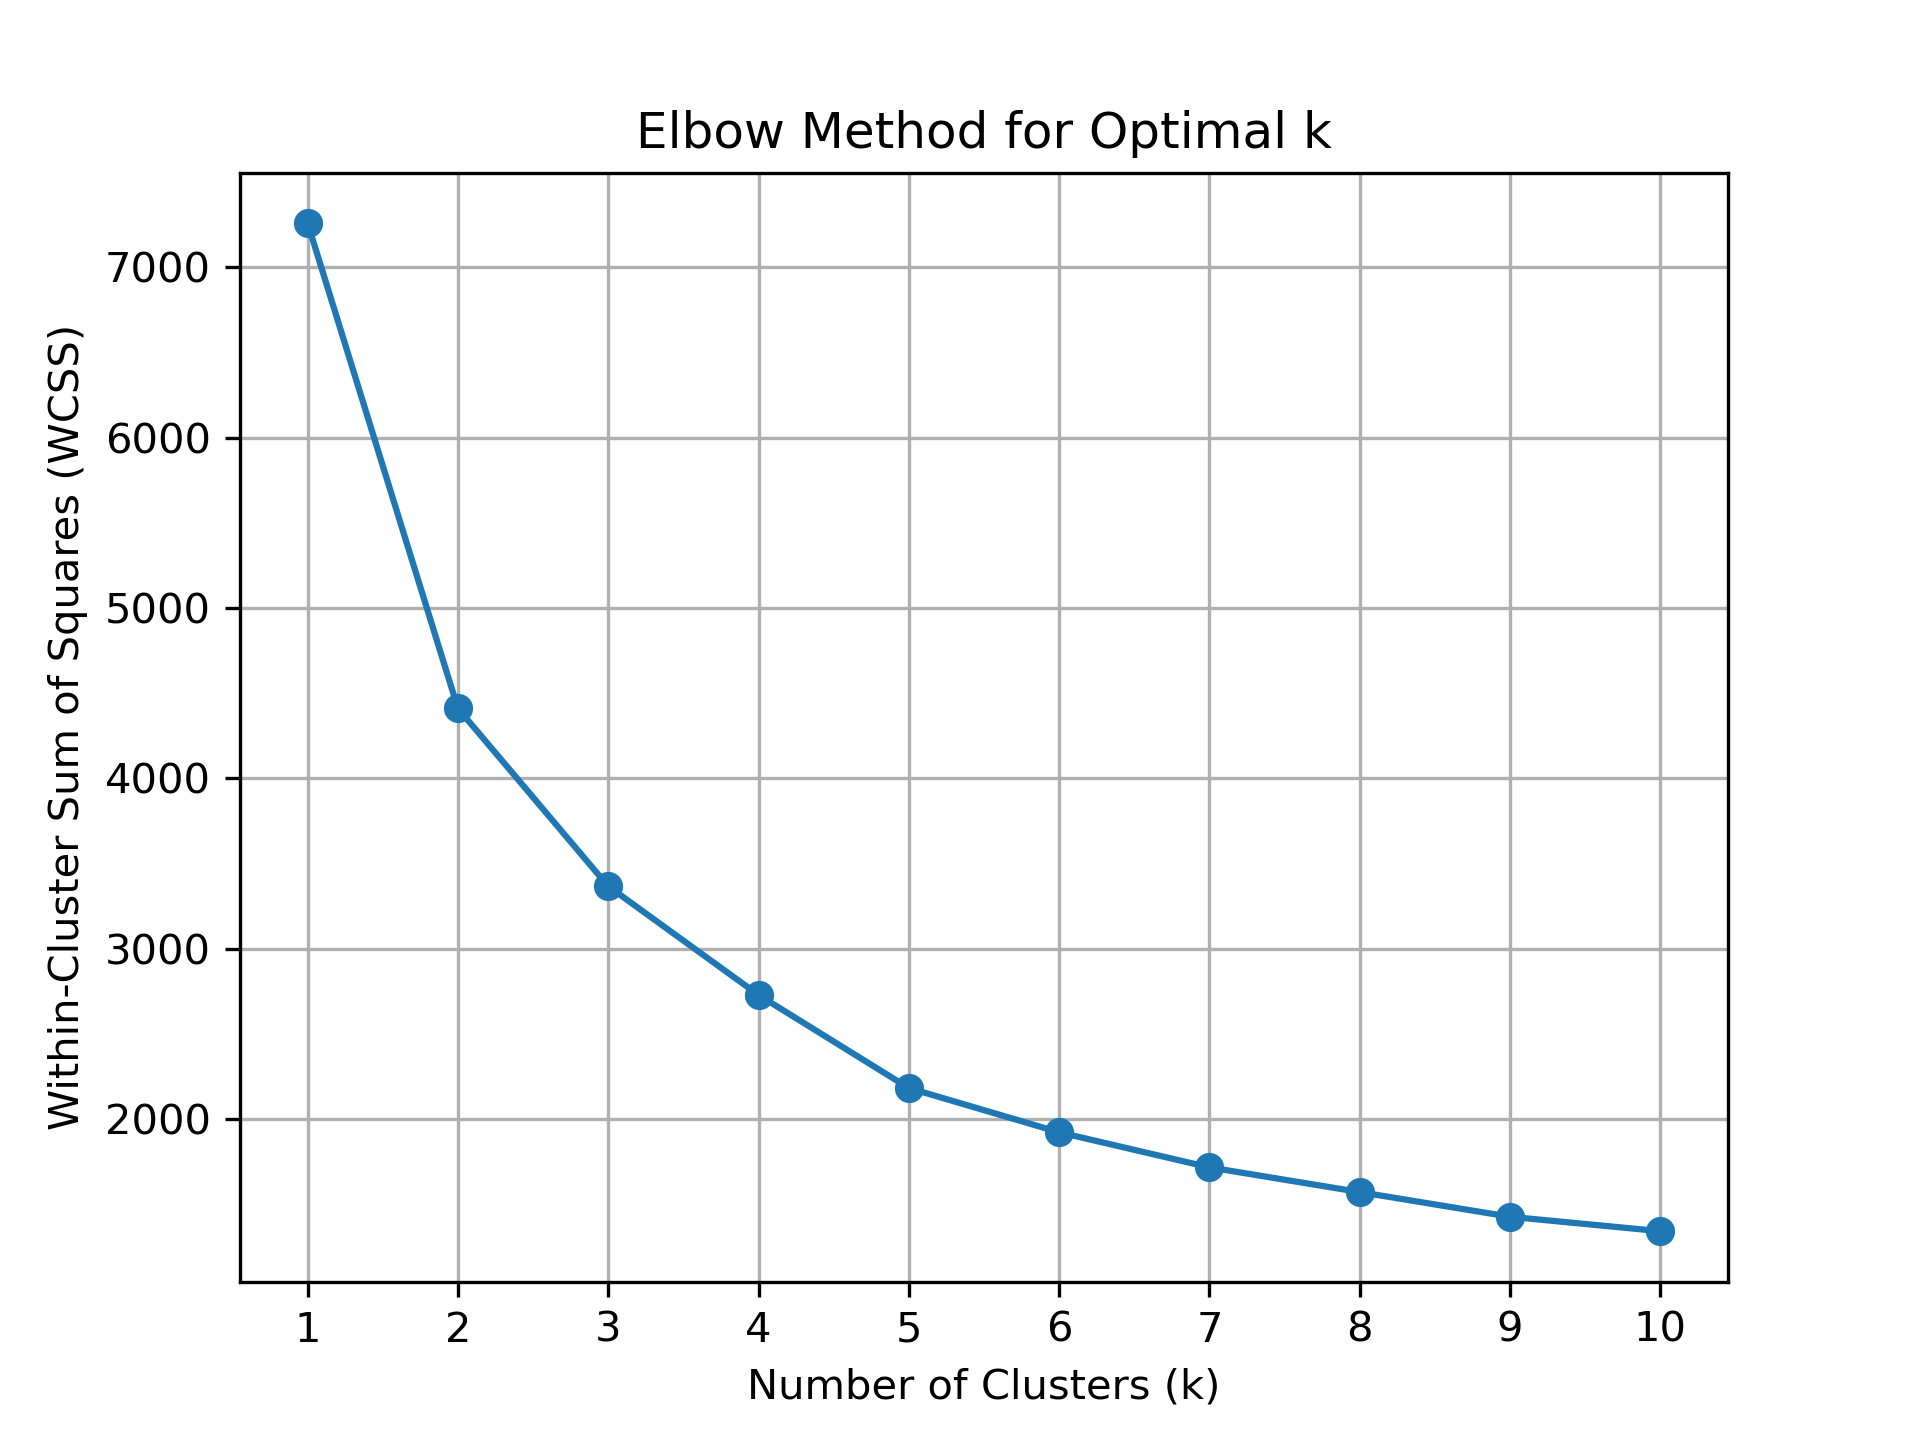
From Score to Sales: K-means Clustering
The clusters indicate distinct patterns in the relationship between critic scores and sales figures. Informed by the elbow method, the optimal number of clusters (K) is 3. Cluster 1 suggests that products with higher critic scores tend to achieve greater sales success, while Cluster 3 represents products facing challenges in achieving both high sales and favorable critic scores. Cluster 2 represents a middle ground. Additionally, alongside each cluster, I visualized the proportion of each genre within these clusters using circle packing diagrams.
See elbow chart here
Source from: Kaggle
Exploring Publisher Performance Across Genres
Explore how game publishers perform across various genres in the dynamic gaming industry. Using Plotly.js, I analyzed key metrics like critic scores, sales, and game releases to build a 3D model. Through the application of z-scores for normalization, I standardized the comparison process, comprehensively assessing publishers' overall performance.
Hover for each publisher's details ⤵
Source from: Kaggle
The average critic scores are categorized into groups and distinct colors are assigned, to simplify and enhance the clarity of the visualization.
Data and Methdology
The two datasets utilized in this study was sourced from Kaggle. With attributes such as sales figures, critic scores,
genres, and etc., the richness and diversity of the datasets make them well-suited for conducting a
comprehensive analysis of the video game industry. Before conducting any analysis, I cleaned missing
data, standardized formats, and re-organized in new csv files for my research questions.
The combination of LDA topic modeling, K-means clustering, and 3D scatter plot visualization
allowed for a comprehensive analysis of the video game datasets. However, I encountered challenges
when I did the 3d scatter plot. The sales and release data for games were all over the map, varying
widely across different genres. To tackle this, I used z-score normalization, which helped
standardize the data,ensuring a more accurate and meaningful analysis.
Takeaways
Through this project, I learned more about data visualization using JavaScript libraries, and discovered the importance of selecting the appropriate visualization tools and techniques based on the research context. While both d3.js and plotly.js offer powerful capabilities, their suitability depends on factors such as the dataset's nature, analysis complexity, and audience requirements. Additionally, I recognized the significance of preprocessing techniques like z-score normalization in standardizing data for more accurate visual representations. Overall, data visualization is an iterative process, and selecting and implementing visualization strategies need adaptability.
Acknowledgments
I learnt a lot from 'Data Visualization with Python and JavaScript, 2nd Edition' by Kyran Dale. The book's thorough explanations of Pandas, Matplotlib, and Plotly significantly improved my grasp of these tools. The examples provided in Jupyter Notebook were particularly inspiring and guided me throughout the development of this project.